Canvas
Product system / Canvasm
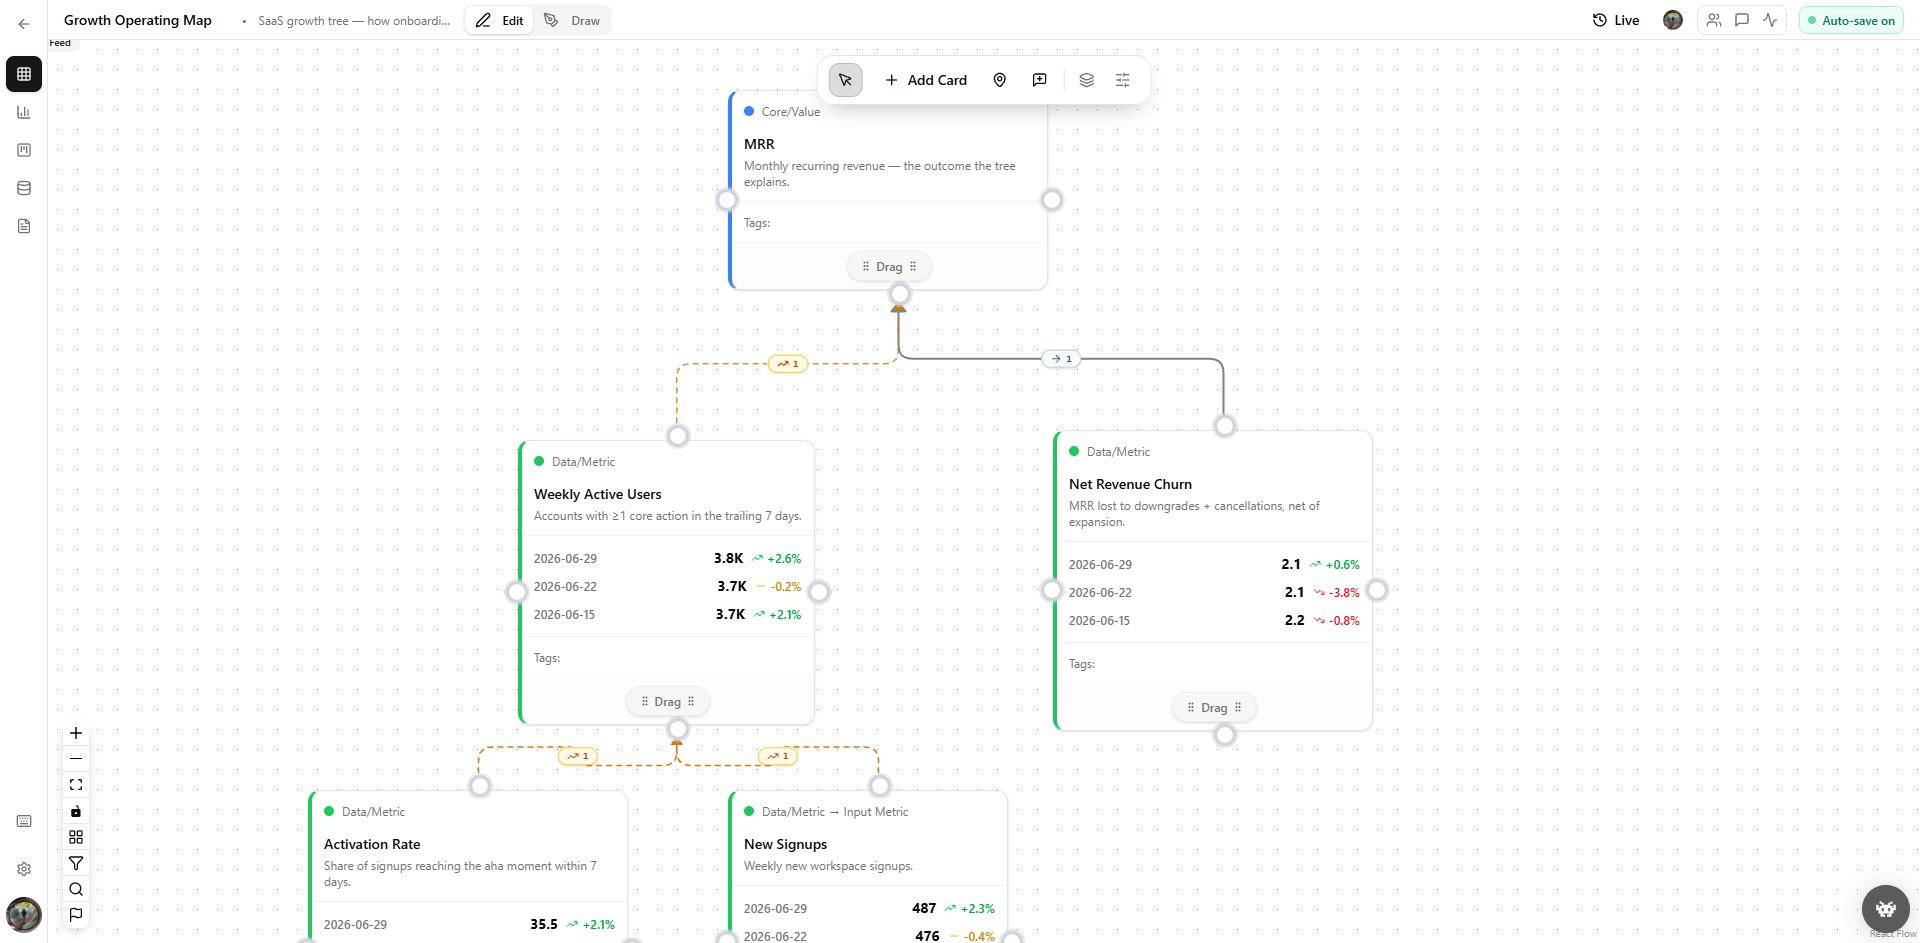
Canvasm turns a strategy document into a system that people and agents can work from. Outcomes, drivers, metrics, actions, hypotheses and evidence stay connected instead of living in separate decks, task boards and dashboards.
01 The build
Canvasm gives each business element a defined role and relationship. Teams can see why a metric matters, which action is meant to move it, what assumption is being tested and which evidence supports the update—without losing the wider commercial model.
Visit Canvasm02 Operating logic
A commercial outcome is decomposed into its drivers and metrics. Actions and hypotheses are attached to the part of the model they are intended to change, then reviewed against current evidence.
03 Product walkthrough
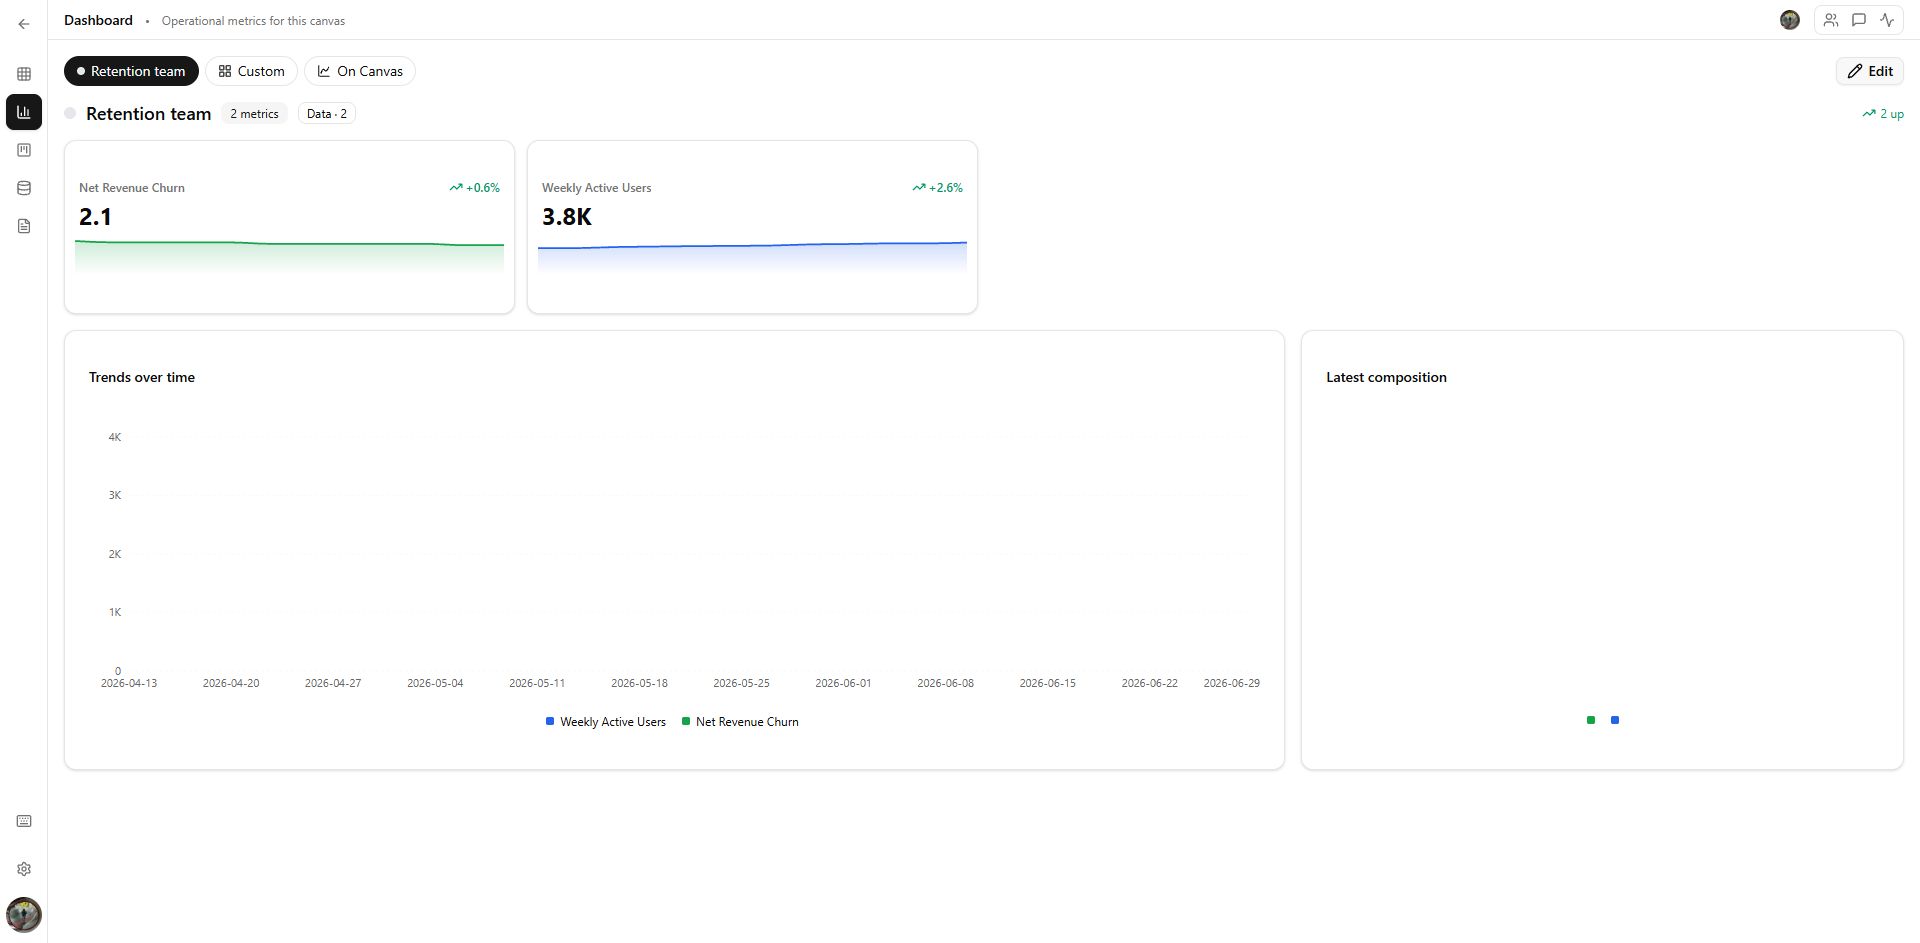
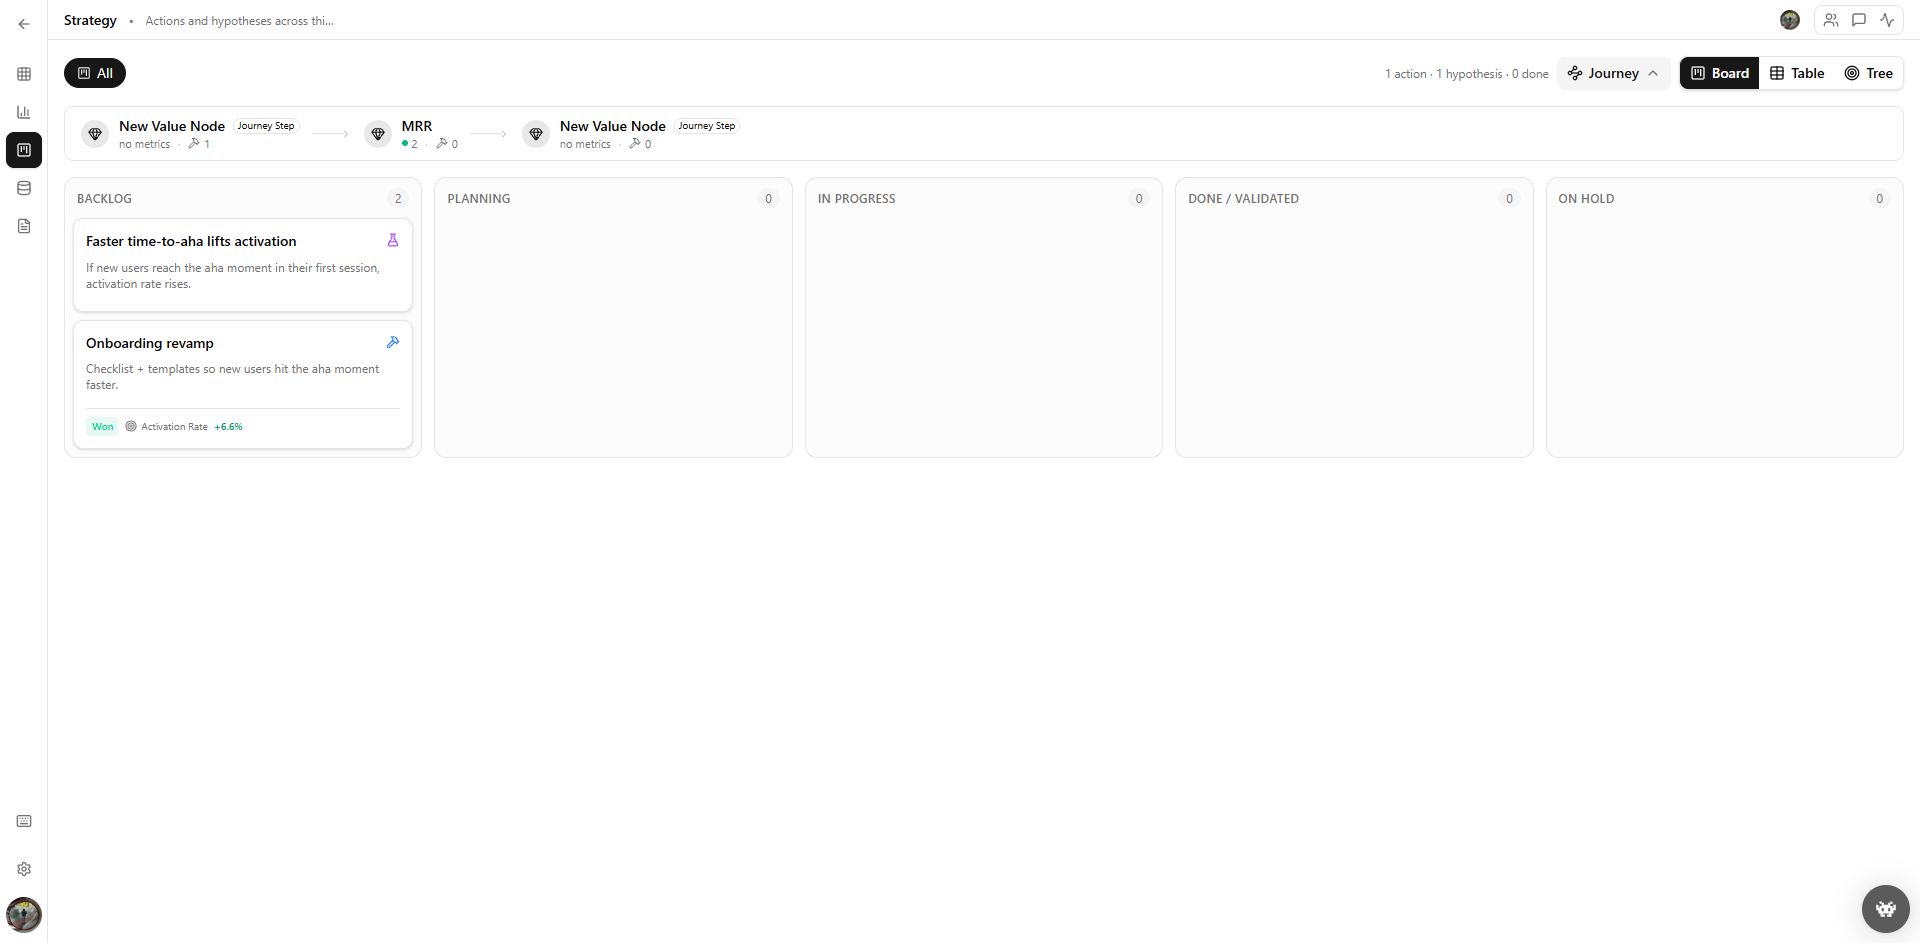
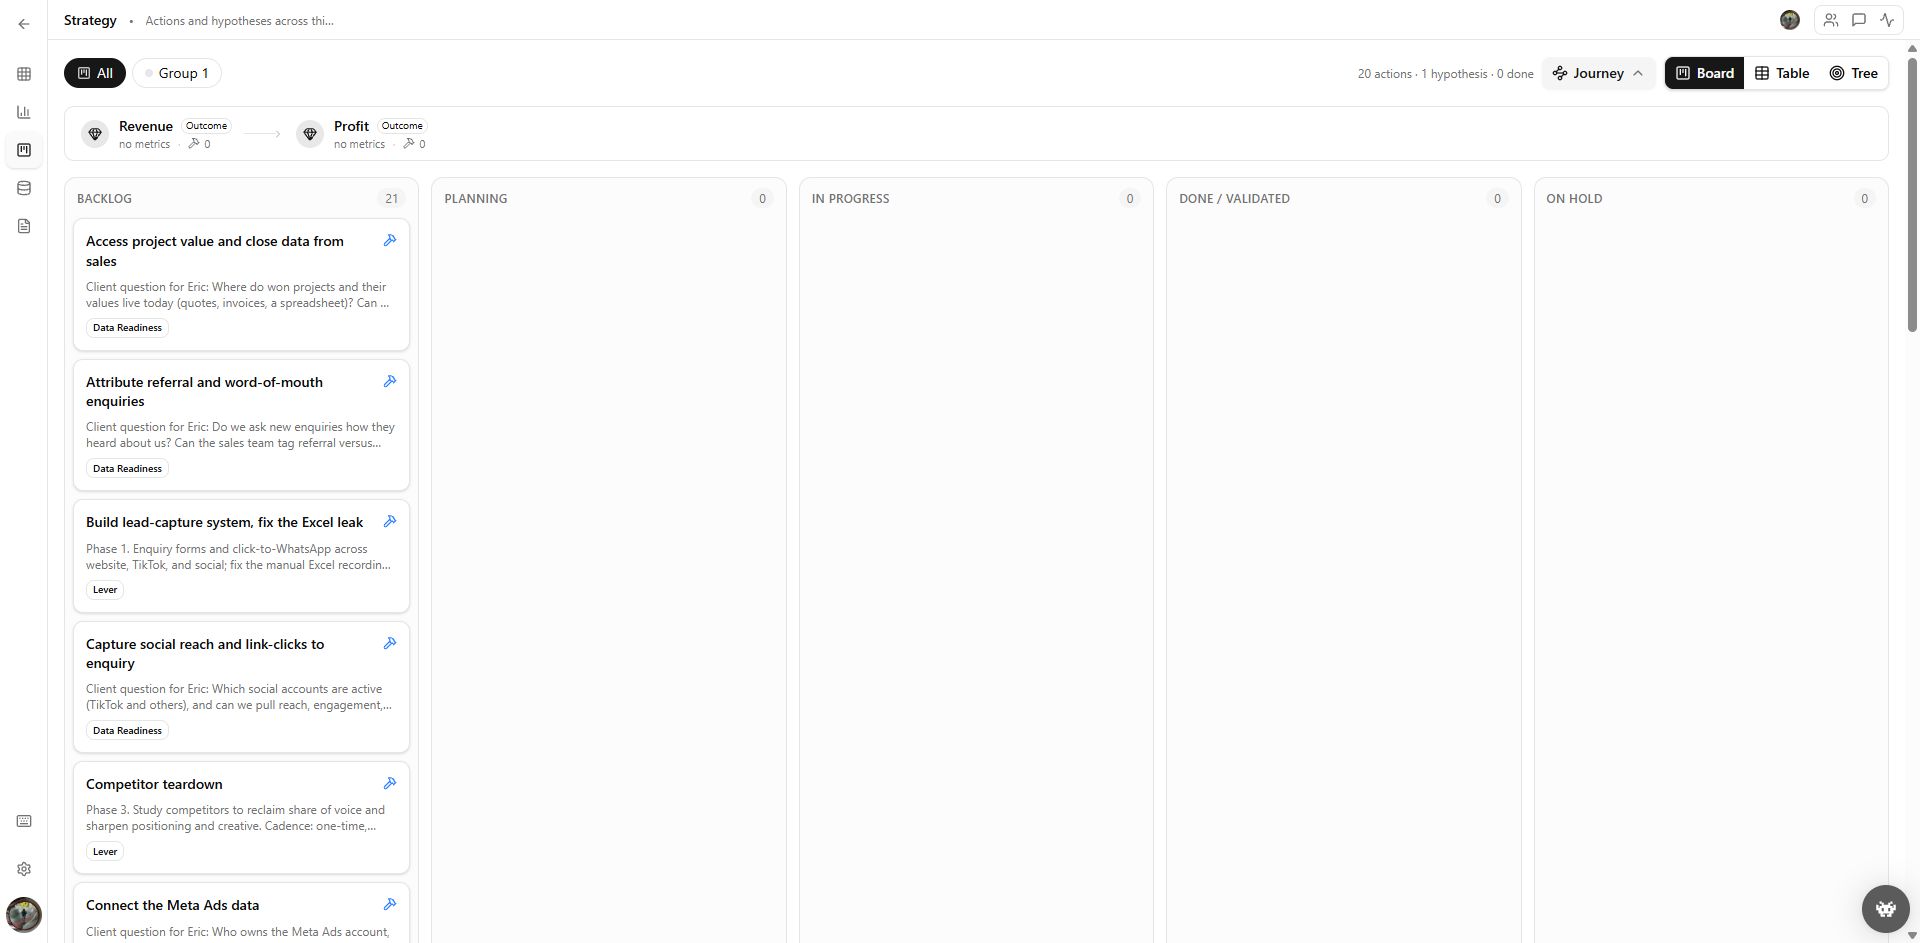
Each screen has a specific operating job. The screenshots below show the current product interface, followed by the function it performs inside the wider workflow.
Canvas
Dashboard
Strategy
Client implementation
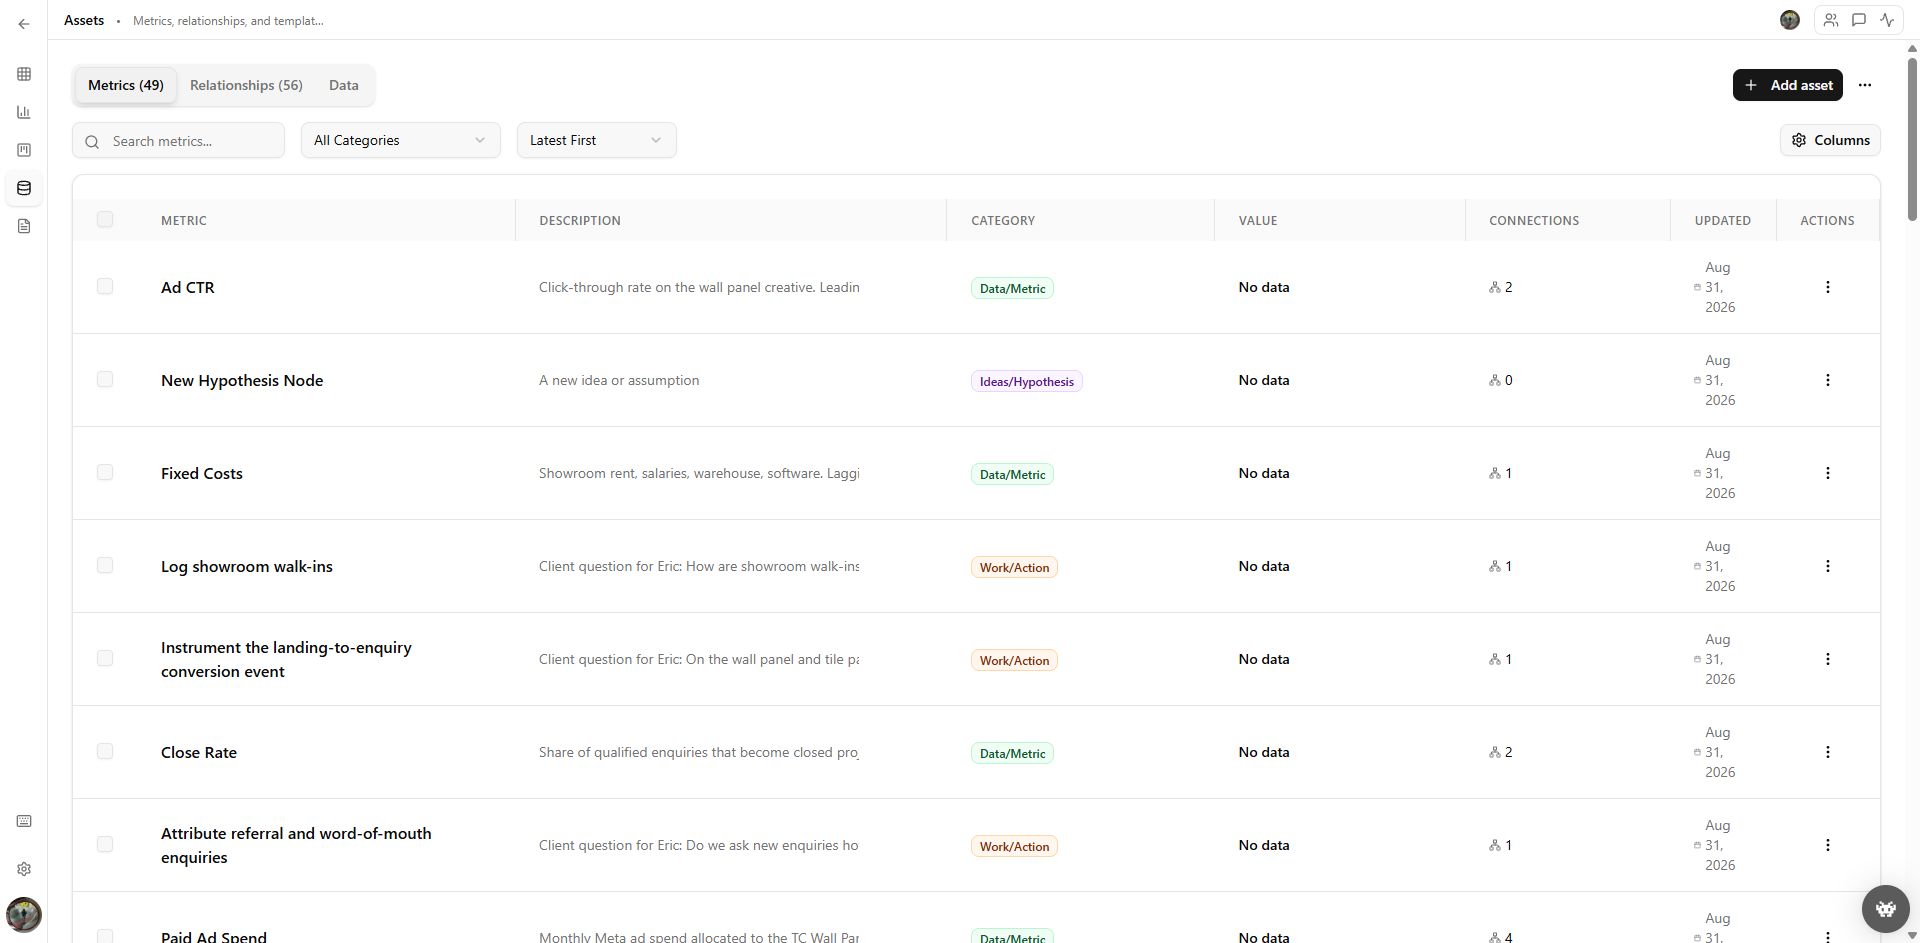
Assets
04 Page map
Visual map of outcomes, drivers, metrics, actions, hypotheses, groups and relationships.
Grouped metric values, trend direction, time series and current composition.
Actions and hypotheses across board, table, tree and journey views.
Searchable metric, relationship and data library with definitions and update state.
Evidence items linked to the cards and relationships they support or challenge.
05 What this proves
The SaaS growth metric values shown are demo data. The Tile Concept views demonstrate implementation structure; they do not claim a measured client outcome unless separately verified and approved for publication.
Next Focused diagnostic
Show us the operating constraint, the systems already in place and the decision your team needs to make faster.
Start a conversation